Persona Help Center
Overview
The Audit Log Explorer lets you browse, search, and filter through all of the activity that happens within your Dashboard. Whether you’re using it to monitor user authentications or track Case closure metrics, the Audit Log Explorer can handle your use cases.
For ingesting User Audit Logs, we suggest either leveraging our API or contacting us for information about our BYOS (Bring Your Own Storage) solutions.
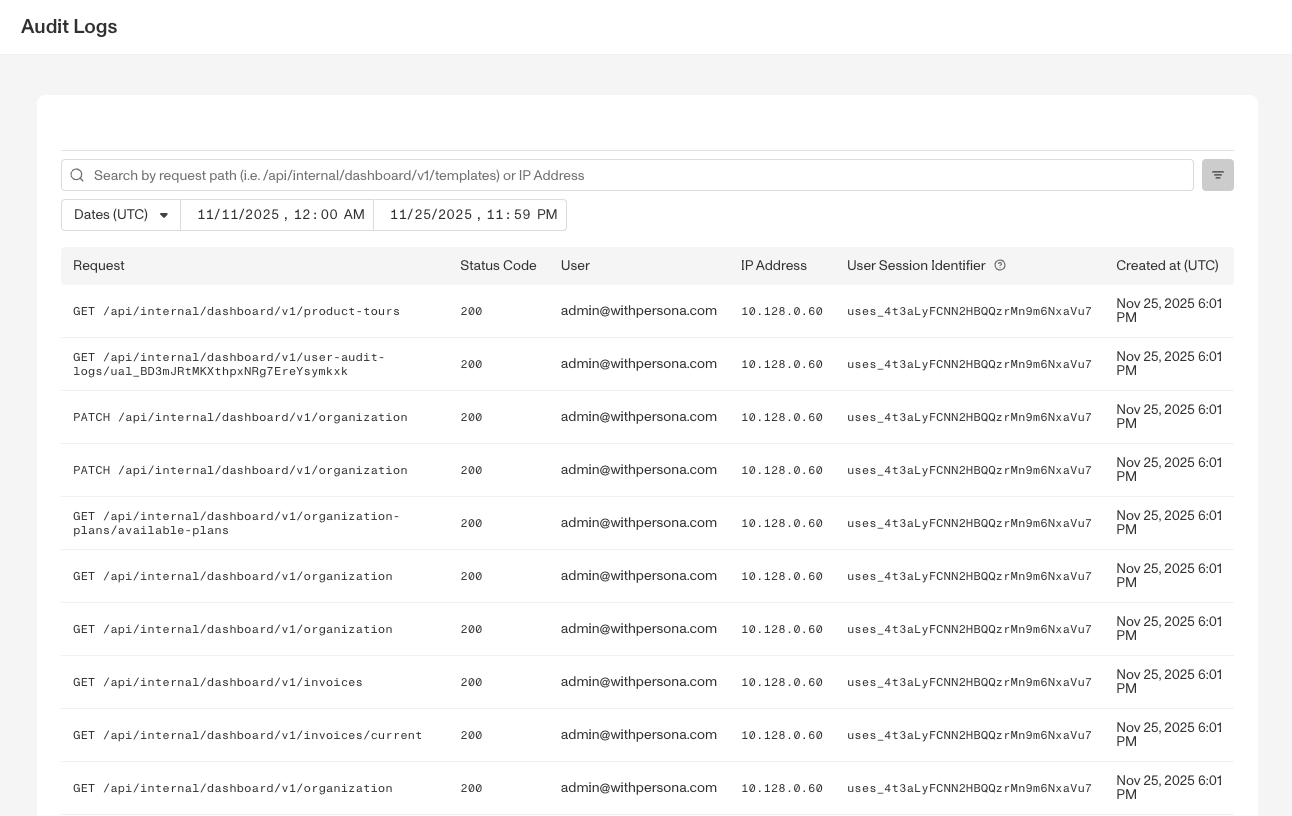
Accessing the audit log explorer
From the Dashboard, navigate to Team > Audit Logs to start browsing through audit logs. By default, the explorer filters are set to the last 14 days of audit logs, with the most recent logs shown first.
To show more logs on the explorer page, scroll to the bottom of the page and use the Items per page dropdown to select from the available options: 10, 25, 50, 100, or 200.
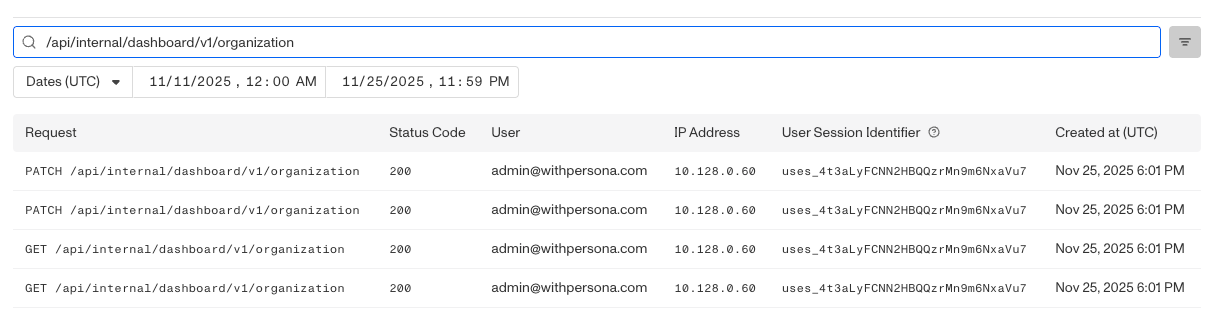
Searching audit logs by request path or IP address
The search bar supports exact matches with request path or IP address. To search, click on the search bar and type in the desired path or IP address.
Filtering audit logs
The Audit Log explorer supports multiple filtering options. By default, the date filter is set to the last 14 days. To add a filter, hover over the filter bar and press the “+” button.
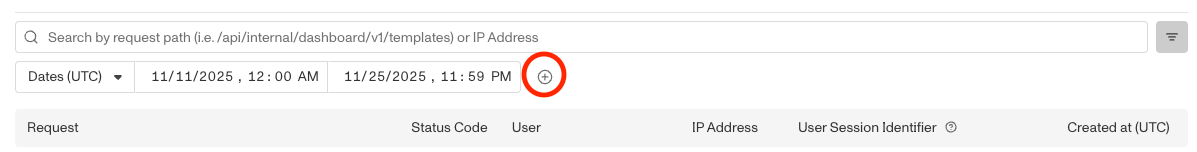
From there, apply any of the following filters:
- Request Method (POST, GET, etc)
- Response Status (200, 201, 400, etc)
- User
Looking at a user audit log
A User Audit Log contains the following information:
- API path & method
- Date of action
- IP address of user
- User performing the action
- User agent (browser information)
- Query parameters
By default, much of the information is redacted for security and privacy reasons.

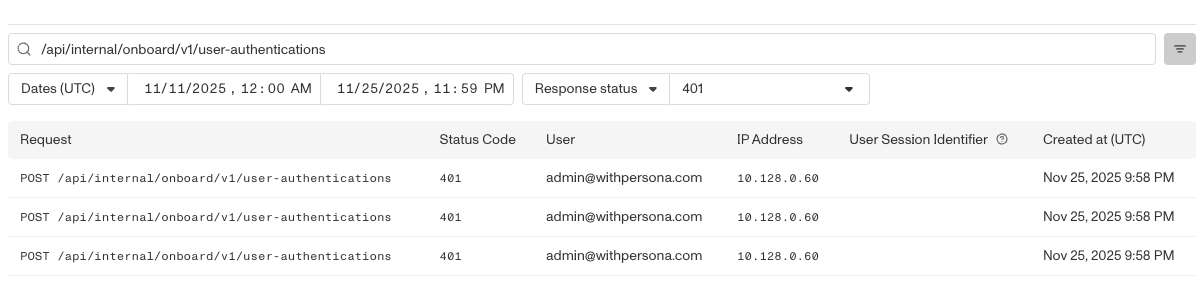
Example user audit log use case
A sample use case could be tracking the instances of failed user authentications. To accomplish this, search on /api/internal/onboard/v1/user-authentications and filter on Response status = 401.