 Persona Help Center
Overview
Saved Views let you create customized views of the API Logs index page, giving you access to commonly filtered lists of API logs. Whether you want to focus on API logs from a specific request method, with a specific status, certain date range, or API key, you can filter and save views that align with your business processes.
Default view
From the Dashboard, navigate to API > API logs to open the API Logs index page. By default, the page opens on the Default view, where you can search, apply filters, and adjust the layout.

The Default view is a sorted view of all API logs from the most recently created API logs to the oldest. The Default view does not have any specified filters but you can add additional filters as needed. And if you find yourself applying the same set of filters repeatedly, consider saving that configuration as a Saved View.
What you can configure in a saved view
Saved Views make it easy to return to your preferred filters with a single click, instead of re-creating them each time. Your API Log list view offers several configurable components:
- Filters applied to each view
- Ability to add multiple filters
Filtering API Logs
To filter your API Log list view and display only the items that meet your criteria:
- Open the filter menu (toggle button with three lines to the right of the search bar).

-
Apply filters such as:
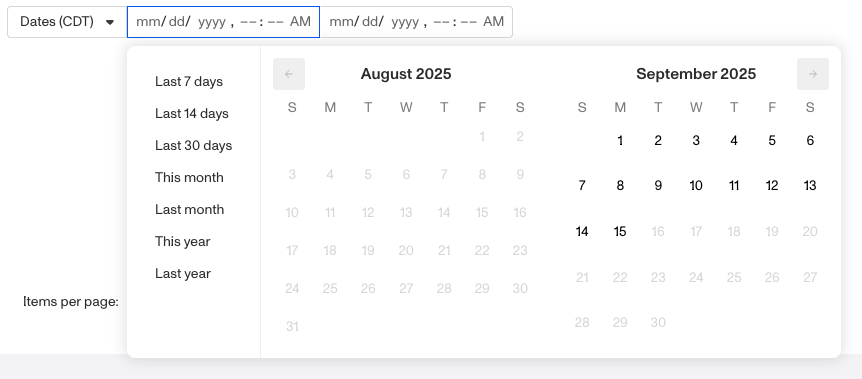
- Dates: Narrow results to API logs within a specific date or date range.
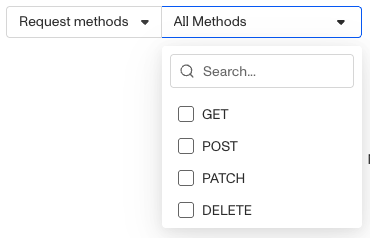
- Request methods: Show only API logs with a certain request method (get, post, patch, delete).
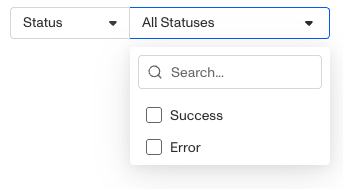
- Status: Show only API logs with a certain status (success, error).
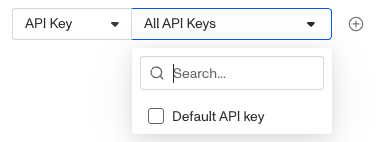
- API Key: Show API logs associated with a specific API key.
-
To add more than one filter, hover next to the last filter row until the “+” button appears, then click it to add another filter.


Creating saved views of filtered API Logs
If you’ve applied filters in the Default view and want to save them for future use, you’ll need to create a new view:
- Hover next to Default view until the “+” button appears.

- Click the button to create your view.
- Give the view a name.
- Use the drop-down menu to duplicate, save, or delete the view. Access this menu later by hovering over the view name and selecting the three-dot menu.

- Once you’ve configured your filters, click Save view to preserve your setup for later.
Managing saved views
To edit a saved view:
- Navigate to API > API logs.
- Select the saved view from the existing views.

- Adjust filters, columns, or other settings as needed.
- Click Save view to apply your changes.
Your updates will overwrite the existing saved view, so you’ll see the new configuration the next time you open it.
Items per page
At the bottom of the API Logs index page, you can control how many API logs are displayed at once. Use the Items per page dropdown to select from the available options: 10, 25, 50, 100, or 200.

Adjusting this setting is helpful if you want to:
- View more API logs on a single page when scanning large datasets.
- Limit the number of API logs displayed for easier navigation.
Your selection will update the table immediately.