
Overview
The Graph Explorer is the visual interface where you run Graph queries and explore the connections they surface. Learn the key features of the interface:
- The main components of the Explorer
- Actions you can take in the Explorer
There are two general ways to approach a query:
- Find a specific Account: search by an exact property value to surface the Accounts connected to a known identity.
- Find a pattern: query across Accounts to surface those that share a property, and investigate the cluster as a whole.
For walkthroughs of both approaches, see Conducting reactive fraud investigations with Graph.
Main components of Graph Explorer
Toolbar

The toolbar has the following components:
Run a Query
1: Query: Toggles the Query editor open or closed.
2: Load: Lets you load a saved Query Template.
View results
3: Select: Enables Select mode. In Select mode, you can select nodes and drag nodes to rearrange them on the canvas.
4: Pan: Enables Pan mode. In Pan mode, you can click and drag to move in any direction on the canvas.
5: Re-layout: Triggers a re-layout of nodes on the canvas. If you have rearranged nodes on the canvas, this resets them to the original layout.
6: Zoom in: Increases the zoom level of the canvas.
7: Zoom out: Decreases the zoom level of the canvas.
8: Zoom: Shows the zoom level of the canvas. This is a text input that lets you change the zoom level. Just edit and press Enter.
Query editor
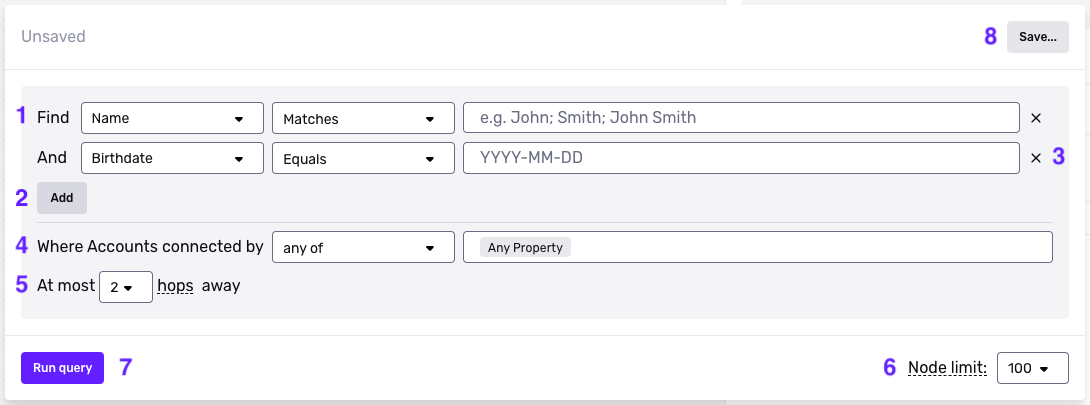
The Query editor is divided into two main sections:
- In the upper section, you specify the properties of Accounts to search for. In Graph, we call these Accounts the starting nodes.
- In the lower section, you specify which “connected” Accounts to also surface. In Graph, we call these Accounts the connected nodes.
Specify the starting nodes
1: Property clause: Select an Account property you want to search by, and provide the value of that property.
2: Add: You can add one or more property clauses to your search query.
3: Remove: Remove a property clause by clicking the “X” icon.
Specify connected nodes
4: Properties: Specify at least one property that defines a “connected” Account. If an Account has the same value for the property as a starting node, it will be considered “connected.”
5: Maximum hops: Choose the maximum number of edges apart in the network a “connected” Account can be from a starting node.
Configure, run, and save a Query
6: Node limit: Configure the number of nodes returned in initial results.
7: Run query: Run the query. Results will be displayed in the canvas.
8: Save: Saves the current query. Saving is what creates a Graph Query Template, which is the saved query you can load again here or run from a Workflow.
Results overview
The Results overview shows summary statistics and other information about Accounts surfaced by a Query. To open the Results overview, click the rectangular “sidebar” icon at the top right of the Graph Explorer:

Canvas
The canvas is the main area of Graph Explorer where Query results appear.
Nodes
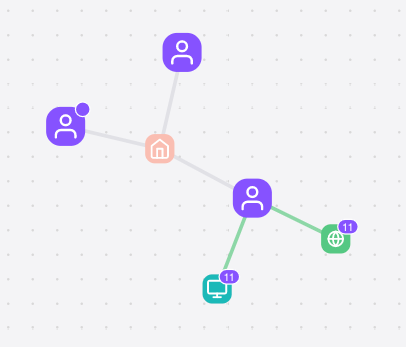
Query results appear as clusters of connected nodes. Each node represents either an Account in Persona, or a property of that Account. A line between an Account node and a property node means that the Account has that property.
Node hover card
When you hover over a node, a hover card appears. The hover card shows details about the node, and actions you can take on the node.
Actions in Graph Explorer
Navigate
Pan
You can pan in any direction on the canvas. There are multiple ways to do this:
- Enable Pan mode using the Pan mode icon in the Toolbar. Then click and drag in any direction on the canvas.
- To temporarily switch into Pan mode, hold down the Space Bar. While holding down the Space Bar, click and drag in any direction on the canvas.
- No matter what mode you’re in, you can always pan by dragging left, right, or diagonal with two fingers on a trackpad.
Zoom in / Zoom out
You can zoom in or out on the canvas. There are multiple ways to do this:
- Click the Zoom in / Zoom out icons in the Toolbar.
- Set a specific zoom percentage by editing the Zoom percentage text input. (See the Toolbar section for details.)
- Hold
cmdand scroll down / up on your computer mouse to zoom in / zoom out.
View results
Select nodes
To select a node, first enable Select mode. Then click any node.
You can select multiple nodes at once. To do this, you can either:
- Click and drag over several nodes, or
- Click on each node while you hold down the
Shiftkey.
Rearrange nodes
To rearrange a node, first enable Select mode. Then click and drag any node.
You can move multiple nodes at once. Select multiple nodes, then click and drag the entire selection.
Hide nodes
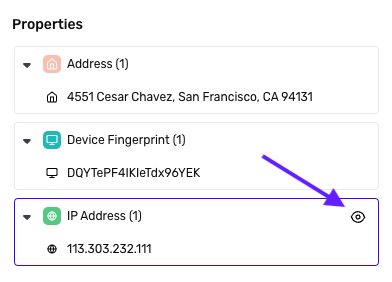
You can hide nodes that have a specific property value.
Open the Results overview. In the Properties section, hover over the property you want. Click the “eye” icon to hide nodes with that property.
Explore results
View node details
Hover over any node to open the node hover card, which contains details about the node. Different information and actions are displayed, depending on the type of node.
Show Connections
If a purple badge appears in the corner of a node, it means the node can be expanded to show additional related Accounts.
To expand a node, hover over it to open its details modal. At the bottom of the modal, click the “Show Connections” icon.
Share results
Export Accounts
You can select one or more Account nodes, and export them as a CSV file.
To export a single Account, hover over it to open its details modal. At the bottom of the modal, click the “Export” icon.
To export multiple Accounts, select multiple Account nodes. Then click the “Export” icon that appears beneath the selection.
To export all Accounts in the results, click Export Accounts at the top right corner of the Explorer interface.
Take action on results
Tag Accounts
You can select one or more Account nodes, and add a Tag to these Accounts.
To Tag a single Account, hover over it to open its details modal. At the bottom of the modal, click the “Tag” icon, and select your desired Tag.
To Tag multiple Accounts, select multiple Account nodes. Then click the “Tag” icon that appears beneath the selection, and select your desired Tag.
Add Property to List
You can add a property to a List. For example, you can add a specific device fingerprint or IP address to a List.
To do this, hover over the property to open its details modal. At the bottom of the modal, click the “Add to List” icon, then select your desired List.
Explore Accounts in Graph from elsewhere in Persona
You can explore an Account’s connections without leaving the page you are on. A ready-to-use Graph view is embedded in other surfaces, such as Cases and Account pages.
The view is driven by the Graph Query Templates you configure. When it loads, the Account in context automatically supplies the account the query runs against: the Account attached to the Case, or the Account whose page you are viewing. It then displays the connections scoped to that Account.
It’s built for fast review context, not full investigation. Within it, reviewers can hover a node to display that Account’s info card; zoom and pan; toggle excluded nodes; export the connected Accounts as a CSV; and Open in Graph Explorer to move into the full interactive view for deeper investigation such as expanding nodes or pivoting across connections.